
This blog will detail how to create a Grok pattern using a grok debugger. For this blog we will be using Elastic Stack’s (ELK) Kibana built-in Grok debugger.
Logstash is a log-shipper component used in ELK. This component can ship data from multiple sources and funnel the data to a storage destination of your choosing. Logstash’s shipping capabilities make the tool useful but it does not stop there. Logstash not only ships data but can refine incoming streams of data to create information more useful. One way it can do this is by using filter plugins.
Filter plugins
A plugin to Logstash, used to process and manipulate logs that are received by Logstash before being shipped elsewhere. Logstash has a wide range of filters, each can specifically analyse the structure of incoming data and transform it into more useful data. There are many filter plugins available, most common filter plugins are:
mutate
csv
json
kv
grok
In this blog article we will be discussing grok plugin. Grok analyses data against pre-defined or custom regex patterns. If the pattern matches a piece of text it stores the data into a new field. Creating a Grok pattern provides more valuable information by turning unstructured data from incoming data sources into structured data.
Sytax and Semantic
Grok builds off regular expression (Regex), using a series of regex to form a Grok pattern and that pattern matches the data submitted. Patterns are made up of %{SYNTAX:SEMANTIC} definitions. SYNTAX defines a regex pattern and SEMANTIC is its identifier providing the event name to store the field value. Patterns used in Grok can be reused, as long as the semantic is unique. For example:

Logstash has a library established patterns along with their regex combination that can be seen here.
Grok Debugger
The grok debugger can be found in Kibana> Dev Tools > Grok Debugger tab.

Inside Grok Debugger tab, you have 3 inputs and 1 output:
Sample Data: An excerpt of data you want to form structured data from.
Grok Pattern: Syntax for Grok Patterns
Custom Pattern: A feature where it is possible to combine pre-defined patterns together to craft a new pattern or create a new custom patterns. The output (if valid) will be recognised in the Grok Pattern input section. This is ideal for logs that does not fit the library of pre-defined grok patterns.
Structured Data: Displays result of your grok pattern. If the GROK pattern is incorrect. GROK Debugger will provide an error code.
Demonstration
In this blog post we’ll use the Grok debugger in Kibana and parse the following message:

To get started, let's copy + paste the data displayed above in sample data.
Then let’s enter into GROK pattern input:

GREEDYDATA is a pre-built pattern that captures everything after the point specified. It is useful to keep GREEDYDATA pattern in the GROK pattern, whilst constructing a pattern item by item. This displays the remainder of the message which can be compared to the pattern being formed.
After click on simulate. This should return a result in Output :

Now let’s start creating a pattern for the message. First determine the format of the data. On immediate glance I can see it looks like a time-date format. Now I have 3 options:
1.
Check Logstash’s list of built-in pattern library to see if a pattern in library matches the following data. 2.
Create a pattern that matches this through trial and testing.
3.
Create custom pattern to match the data.
I’ll start with option one. The first piece of data is:

When looking at the list of pre-built patterns I can see the TIMESTAMP_ISO8601 pattern may fit the first piece. I'll test it out. Here is the result:

Looking good so far! As you can see you having GREEDYDATA pattern at the end whilst you’re constructing your pattern proves useful to see what part of the message comes next.
Now let’s move onto the next one piece in the data.

I’ll try Option 1 again, I see there are a few patterns that might work with this data:
NOTSPACE, WORD, USERNAME
Fortunately in this instance, reading the data provides context for what pattern i should use. So i’ll use USERNAME.

Let’s add the next piece. on the list is:

Typically Grok is used to create structured data for log data, certain events produce a pieces of data that are empty. This is why the sample message has a -, indicating a null field. I could either skip this field or use NOTSPACE to capture it. For this example i will simply skip the field. You can skip the field by entering the same character in the GROK filter and the Structured data field will not display that particular character.
I will now parse the rest.

For each segment of the message i use the following:
127.0.0.1 - IP Pattern captures
"GET /server-status HTTP/1.1" - QUOTEDSTRING Pattern captures everything within the double quotes.
200 - Can use NUMBER INT Pattern
2326 - GREEDYDATA Pattern this is likely a port. And can use NUMBER or INT pattern.
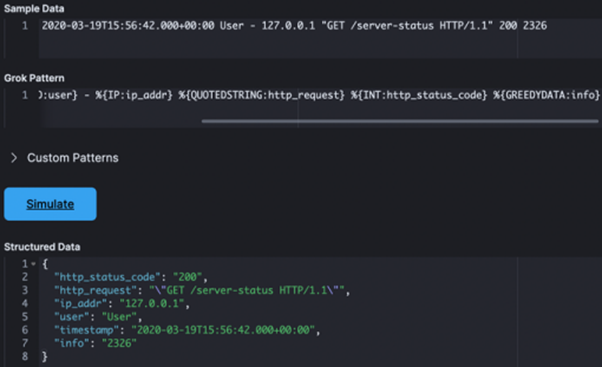
The final output looks like this.
Debugging your pattern
There may come a time when you simulate your pattern and Structured Data output returns blank output as well as an error prompt appears in the bottom left of the screen. This is due to grok parsing error. Consider the following:
Have you made any changes to the sample data?
Have you made any changes to the grok pattern?
Is the type of grok pattern used correct?
If at any point one of the considerations is true, remove the most recent change you made and simulate again and keep undoing until an output is returned. Once the output has returned begin to append on the end of the working pattern.
Grok debugger alternatives
If you do not have access to a Kibana instance there are web-based grok debugger sites that will largely provide the same function: http://grokdebugger.com
https://grokdebug.herokuapp.com/
https://grokconstructor.appspot.com/
Note: These web based debuggers do not have a Custom Pattern feature.